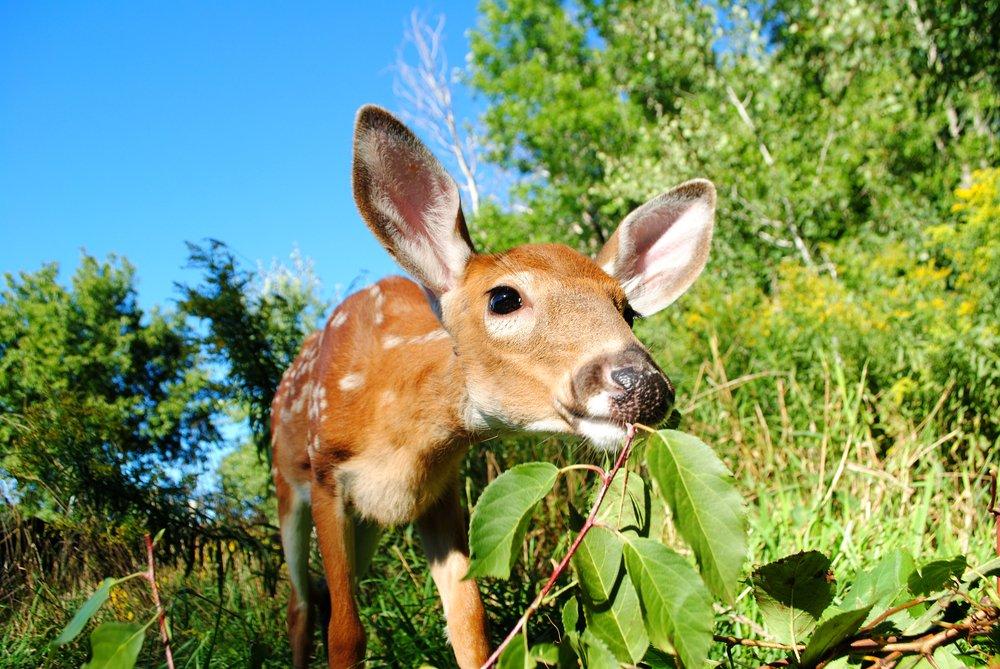
Part 9 of 9: What's the Fawn Situation Like Near You?
I remember when every doe I saw had two (sometimes three) fawns — even into fall and winter. Today, that's a rare sight for most hunters. In fact, in some states, it's more common to see a doe without a fawn than with one. That's a scary truth that is already negatively impacting whitetail populations throughout the country. The Quality Deer Management Association (QDMA) addressed this in the 2019 Whitetail Report.
But first, what is a fawn recruitment rate? It's the number of fawns per adult doe within the herd. If the fawn survives until hunting season, it is recruited into the herd. Then, fawn recruitment rates are recorded just prior to the beginning of hunting season to determine what the rate is for a given area.
The good news — we're better than ever at receiving accurate measurements. The bad news — those measurements are at their lowest in decades.
QDMA surveyed state and provincial wildlife agencies in the U.S. and Canada and asked them to provide their estimated fawn recruitment rate for 2017, QDMA said. We conducted similar surveys in 2011 and 2014, so we already had state-by-state fawn recruitment rates for 2000, 2005, 2010 and 2014. Our new data allowed us to compare regional fawn recruitment rates and see if/how the average recruitment rates changed during the past 18 years. This analysis is especially timely given recent predator population increases.
Nationally, the average fawn recruitment rate declined significantly from 2000 to 2005, dropped again from 2005 to 2010, and remained similar from 2010 to 2017, QMDA continued. The Midwest recruited significantly more fawns per doe (0.81) than the Northeast (0.56) or Southeast (0.57 fawns per doe), but the national average (0.65) meant that on average it took three does to recruit two fawns in 2017.
Not all states provided data on fawn recruitment rates. Only five states in the Southeast, 10 states in the Northeast, eight states in the Midwest and five states in the West provided data. However, more state agencies continue to measure and report this information each year as they begin to realize how important it is.
There are multiple ways to estimate the fawn recruitment rate, QDMA said. Some states use hunter observation rates, some use fawn-to-doe harvest ratios, and others use a combination of these and/or other techniques. Given this variety, the data in the following table is not directly comparable among states. However, it is very comparable across years for any given state. Surprisingly, several states do not estimate their fawn recruitment rate. Given the importance of this index, the QDMA encourages all deer managers (large and small, public and private) to collect fall/winter observation and harvest data to estimate the fawn recruitment rate. This statistic should be estimated annually and compared across years to identify changes in herd health and/or predation rates.
The states with the highest recruitment rates were Illinois (1.18), Kentucky (1), Missouri (.94), Wisconsin (.9) and South Carolina (.88). The outlier here is South Carolina, as one would expect it to be much lower and more in line with its southern neighbors. Perhaps policies and procedures South Carolina has put in place have increased fawn survival. Time will tell.
Southeast
- Arkansas: .45
- Georgia: .54
- North Carolina: .55
- South Carolina: .88
- Texas: .41
Northeast
- Delaware: .54
- Maine: .64
- Maryland: .50
- Massachusetts: .70
- New Hampshire: .61
- New York: .41
- Pennsylvania: .57
- Vermont: .73
- Virginia: .42
- West Virginia: .51
Midwest
- Illinois: 1.18
- Indiana: .60
- Kansas: .47
- Kentucky: 1.0
- Missouri: .94
- Ohio: .60
- South Dakota: .78
- Wisconsin: .90
West
- Arizona: .38
- Colorado: .54
- New Mexico: .34
- Utah: .59
- Wyoming: .70
In the Southeast, South Carolina (.88), North Carolina (.55) and Georgia (.54) were the top three, with an overall .57 for a region average. In the Northeast, Vermont (.73), Massachusetts (.7) and Maine (.64) comprised the top spots, with an overall .56 for the region average. Moving to the Midwest, Illinois (1.18), Kentucky (1) and Missouri (.94) took top honors, with a .81 overall region average. And in the West, Wyoming (.7), Utah (.59) and Colorado (.54) had the highest rates, with a .51 region average. Looking at the historical data, the most troubling statistic is that, since 2000, region averages are down .32 in the Southeast, .13 in the Northeast and .05 in the Midwest.
What causes of mortality accounted for the highest die-off varied from region to region and state to state. However, the biggest universal factors were coyotes and bobcats. Then, in some areas, black bears, cougars, wolves and grizzlies also took a toll on whitetails, reducing fawn recruitment rates.
As we continue to understand more about predation and its effects on deer and deer hunting, it's crucial we're aware of it where we hunt. If we can't (or aren't) managing predators, we have to reduce hunter harvest. Something has to give. And if we don't remove an appropriate number of predators from the equation, there are less deer to harvest. Taking too many deer in areas with heavy, un-checked predation is already reducing deer populations across the continent.
It's time to take action.
2019 Whitetail Report
- New Antlered Buck Harvest Statistics
- The States Tagging the Youngest and Oldest Bucks
- Deer Disease Updates
- Where Deer Urine Is and Isn't Banned
- Laws on Deer Tracking Dogs by State
- New Deer-Related Automobile Accident Trends
- Where Most Non-Resident Deer Hunters Are Going Now
- The Current Status on Deer Processing
- What Fawn Recruitment Rates Look Like Today
Don't miss: 12 Unethical Shots You Shouldn't Take on Deer
Are you a deer hunter wanting to learn how to accomplish your goals? Check out our stories, videos and hard-hitting how-to's on deer hunting.


